
Unicorn Model
Unicorn Model
Understanding the Confluence of Liquidity Sweeps, Breaker Blocks, and Fair Value Gaps
Understanding the Confluence of Liquidity Sweeps, Breaker Blocks, and Fair Value Gaps

What Is the Unicorn Model?
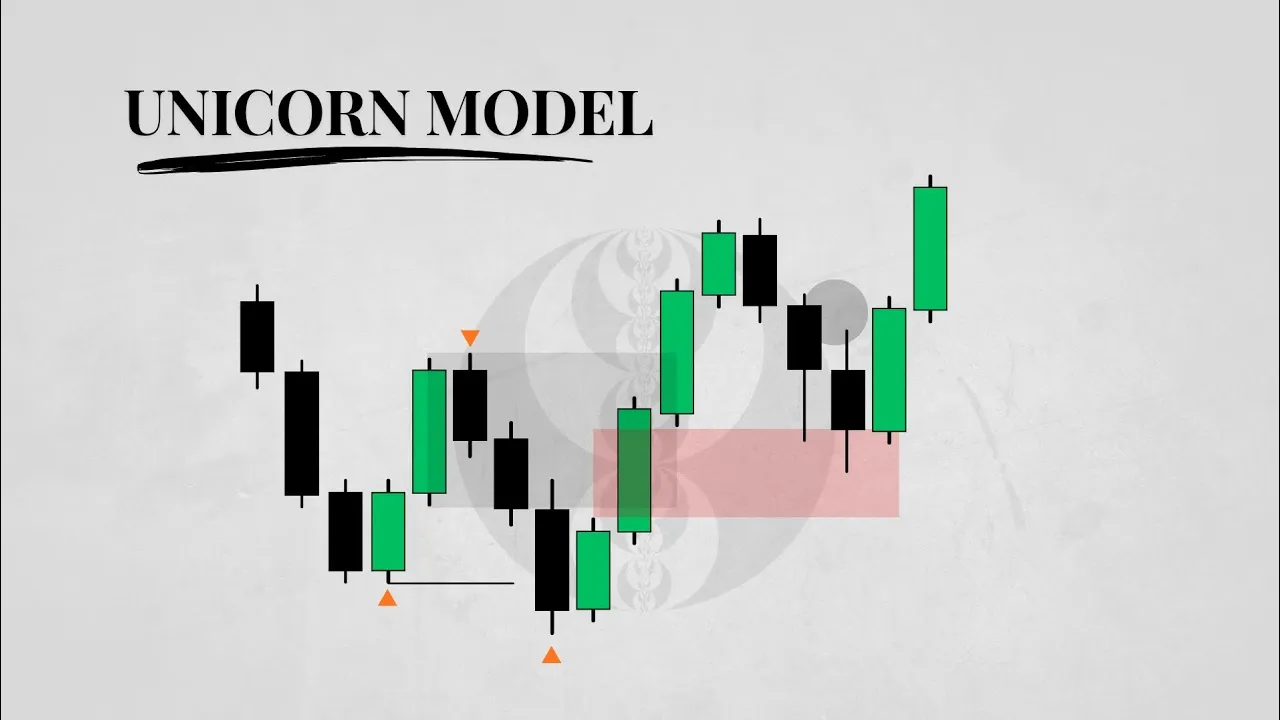
The Unicorn Model is an ICT trading model that combines a Breaker Block with a Fair Value Gap (FVG) to identify potential entry opportunities.
What makes this model interesting is the confluence behind it. Instead of relying on just one concept, it combines a liquidity sweep, a Market Structure Shift (MSS), a Breaker Block, and a Fair Value Gap to create a more structured entry model.
The Unicorn Model comes into play when the Breaker Block and Fair Value Gap overlap, creating an area where you can look for potential trade entries.
How Does the Unicorn Model Form?
Liquidity Sweep
The first thing you want to see is a liquidity sweep.
Price needs to take out a significant swing high or swing low before potentially reversing in the opposite direction. This is important because the liquidity sweep sets the stage for the rest of the setup.
For a bullish Unicorn Model, you would typically look for price to sweep a swing low. For a bearish Unicorn Model, you would look for price to sweep a swing high.

Market Structure Shift
After the liquidity sweep, the next thing you want to see is a Market Structure Shift (MSS).
For a bullish setup, price should shift structure to the upside after sweeping the low. For a bearish setup, price should shift structure to the downside after sweeping the high.
Ideally, this shift should happen with strong, impulsive price movement. This displacement is important because it can leave a Fair Value Gap behind.

The Breaker Block and Fair Value Gap
After the Market Structure Shift, you should be able to identify the Breaker Block and the fair value gap.
The Unicorn Model forms when the Breaker Block and Fair Value Gap overlap. This overlapping area is what makes the setup different from simply trading a Breaker Block or a Fair Value Gap on its own.
For a bullish Unicorn Model, you are looking for the bullish Breaker Block and Fair Value Gap to align. For a bearish Unicorn Model, you are looking for the bearish versions to align.

Image: Chart example highlighting the overlapping Breaker Block and Fair Value Gap that form the Unicorn Model.
How to Trade the Unicorn Model
The best way to use the Unicorn Model is as an entry confirmation after identifying a higher-timeframe Point of Interest (POI).
For example, let's say price is approaching a higher-timeframe bullish POI. Rather than entering immediately when price reaches that area, you can drop to a lower timeframe and wait for a Unicorn Model.
You can then wait for price to retrace into the overlapping area before considering an entry, with your stop loss and target determined by your trading plan.

Stop-Loss Placement for the Unicorn Model
When trading the Unicorn Model, there are two ways you can approach stop-loss placement. You can place your stop loss directly beyond the Breaker Block, or you can place it beyond the swing point.
Stop Loss Below or Above the Breaker Block
The first approach is to place your stop loss just beyond the Breaker Block. For a bullish Unicorn Model, you place it at the low of the Breaker Block, while for a bearish Unicorn Model, you place it at the high of the Breaker Block.
The advantage of this approach is that it gives you a tighter stop loss. This means you can potentially achieve a higher risk-to-reward ratio, depending on your entry and target.
However, because your stop loss is closer to the entry, price has less room to move against you. It is possible for price to move slightly beyond the Breaker Block and stop you out before eventually moving in your expected direction.

Stop Loss at the Swing Point
The second approach is to place your stop loss at the swing point that would invalidate your setup.
For a bullish Unicorn Model, this would typically be at the swing low that led to the impulsive move to the upside. For a bearish Unicorn Model, it would be at the swing high that led to the impulsive move to the downside.
The advantage of this approach is that it gives price more room to move. Price could move slightly beyond the Breaker Block without immediately stopping you out. As long as the swing point that invalidates your setup remains intact, your original trade idea may still be valid.
The downside, however, is that this approach gives you a wider stop loss, which may reduce your risk-to-reward ratio for the same target.

Which Approach Should You Use?
Both approaches have their advantages and disadvantages. Placing your stop loss beyond the Breaker Block gives you a tighter stop, while placing it beyond the swing point gives the trade more room to breathe.
Neither approach is perfect. The important thing is to understand the difference, choose the method that fits your trading plan, and apply it consistently. Always calculate your position size based on your stop-loss distance so that your risk remains controlled.
Remember, the model does not guarantee that price will reverse or continue in your expected direction. You still need to manage your risk and know where your trade idea becomes invalid.
Live Chart Example

From the image above, we can see that price left a one-hour Internal Range Liquidity (IRL). Price has now returned to that area, and we are anticipating a move from Internal Range Liquidity (IRL) to External Range Liquidity (ERL).
Based on our analysis, we are bearish and will be looking for selling opportunities. Since price is currently trading within our one-hour Point of Interest (POI), we can now drop to a lower timeframe to look for an entry confirmation.
For a one-hour Point of Interest, we can use the five-minute timeframe to identify our entry.
Five-Minute Timeframe

As price enters our Internal Range Liquidity, we can see that it sweeps the previous high. After the sweep, price moves impulsively to the downside, creating a Market Structure Shift (MSS).
This shift in structure gives us a Breaker Block, and within that Breaker Block, we can also identify a Fair Value Gap. The area where both the Breaker Block and Fair Value Gap overlap is our Unicorn Model.
We can now look to place a sell limit order within this overlapping area, provided the setup meets our entry criteria.
For our stop loss, we have two options. We can use the aggressive approach by placing it just above the bearish Breaker Block, or the conservative approach by placing it above the swing high that invalidates our setup.
For this example, we will target a 1:2 risk-to-reward ratio.
Image: Five-minute chart showing the liquidity sweep, Market Structure Shift, Breaker Block, Fair Value Gap, entry area, stop loss, and take-profit level.
Trade Outcome

As we can see in the image above, price returned to the area where the Breaker Block and Fair Value Gap overlap, triggering our entry. Price then moved decisively to the downside and reached our take-profit target at a 1:2 risk-to-reward ratio.
This example shows how we can combine a higher-timeframe Point of Interest with a lower-timeframe Unicorn Model to identify a potential trade opportunity.
Youtube Video
What Is the Unicorn Model?
The Unicorn Model is an ICT trading model that combines a Breaker Block with a Fair Value Gap (FVG) to identify potential entry opportunities.
What makes this model interesting is the confluence behind it. Instead of relying on just one concept, it combines a liquidity sweep, a Market Structure Shift (MSS), a Breaker Block, and a Fair Value Gap to create a more structured entry model.
The Unicorn Model comes into play when the Breaker Block and Fair Value Gap overlap, creating an area where you can look for potential trade entries.
How Does the Unicorn Model Form?
Liquidity Sweep
The first thing you want to see is a liquidity sweep.
Price needs to take out a significant swing high or swing low before potentially reversing in the opposite direction. This is important because the liquidity sweep sets the stage for the rest of the setup.
For a bullish Unicorn Model, you would typically look for price to sweep a swing low. For a bearish Unicorn Model, you would look for price to sweep a swing high.
Market Structure Shift
After the liquidity sweep, the next thing you want to see is a Market Structure Shift (MSS).
For a bullish setup, price should shift structure to the upside after sweeping the low. For a bearish setup, price should shift structure to the downside after sweeping the high.
Ideally, this shift should happen with strong, impulsive price movement. This displacement is important because it can leave a Fair Value Gap behind.
The Breaker Block and Fair Value Gap
After the Market Structure Shift, you should be able to identify the Breaker Block and the fair value gap.
The Unicorn Model forms when the Breaker Block and Fair Value Gap overlap. This overlapping area is what makes the setup different from simply trading a Breaker Block or a Fair Value Gap on its own.
For a bullish Unicorn Model, you are looking for the bullish Breaker Block and Fair Value Gap to align. For a bearish Unicorn Model, you are looking for the bearish versions to align.
Image: Chart example highlighting the overlapping Breaker Block and Fair Value Gap that form the Unicorn Model.
How to Trade the Unicorn Model
The best way to use the Unicorn Model is as an entry confirmation after identifying a higher-timeframe Point of Interest (POI).
For example, let's say price is approaching a higher-timeframe bullish POI. Rather than entering immediately when price reaches that area, you can drop to a lower timeframe and wait for a Unicorn Model.
You can then wait for price to retrace into the overlapping area before considering an entry, with your stop loss and target determined by your trading plan.
Stop-Loss Placement for the Unicorn Model
When trading the Unicorn Model, there are two ways you can approach stop-loss placement. You can place your stop loss directly beyond the Breaker Block, or you can place it beyond the swing point.
Stop Loss Below or Above the Breaker Block
The first approach is to place your stop loss just beyond the Breaker Block. For a bullish Unicorn Model, you place it at the low of the Breaker Block, while for a bearish Unicorn Model, you place it at the high of the Breaker Block.
The advantage of this approach is that it gives you a tighter stop loss. This means you can potentially achieve a higher risk-to-reward ratio, depending on your entry and target.
However, because your stop loss is closer to the entry, price has less room to move against you. It is possible for price to move slightly beyond the Breaker Block and stop you out before eventually moving in your expected direction.
Stop Loss at the Swing Point
The second approach is to place your stop loss at the swing point that would invalidate your setup.
For a bullish Unicorn Model, this would typically be at the swing low that led to the impulsive move to the upside. For a bearish Unicorn Model, it would be at the swing high that led to the impulsive move to the downside.
The advantage of this approach is that it gives price more room to move. Price could move slightly beyond the Breaker Block without immediately stopping you out. As long as the swing point that invalidates your setup remains intact, your original trade idea may still be valid.
The downside, however, is that this approach gives you a wider stop loss, which may reduce your risk-to-reward ratio for the same target.
Which Approach Should You Use?
Both approaches have their advantages and disadvantages. Placing your stop loss beyond the Breaker Block gives you a tighter stop, while placing it beyond the swing point gives the trade more room to breathe.
Neither approach is perfect. The important thing is to understand the difference, choose the method that fits your trading plan, and apply it consistently. Always calculate your position size based on your stop-loss distance so that your risk remains controlled.
Remember, the model does not guarantee that price will reverse or continue in your expected direction. You still need to manage your risk and know where your trade idea becomes invalid.
Live Chart Example
From the image above, we can see that price left a one-hour Internal Range Liquidity (IRL). Price has now returned to that area, and we are anticipating a move from Internal Range Liquidity (IRL) to External Range Liquidity (ERL).
Based on our analysis, we are bearish and will be looking for selling opportunities. Since price is currently trading within our one-hour Point of Interest (POI), we can now drop to a lower timeframe to look for an entry confirmation.
For a one-hour Point of Interest, we can use the five-minute timeframe to identify our entry.
Five-Minute Timeframe
As price enters our Internal Range Liquidity, we can see that it sweeps the previous high. After the sweep, price moves impulsively to the downside, creating a Market Structure Shift (MSS).
This shift in structure gives us a Breaker Block, and within that Breaker Block, we can also identify a Fair Value Gap. The area where both the Breaker Block and Fair Value Gap overlap is our Unicorn Model.
We can now look to place a sell limit order within this overlapping area, provided the setup meets our entry criteria.
For our stop loss, we have two options. We can use the aggressive approach by placing it just above the bearish Breaker Block, or the conservative approach by placing it above the swing high that invalidates our setup.
For this example, we will target a 1:2 risk-to-reward ratio.
Image: Five-minute chart showing the liquidity sweep, Market Structure Shift, Breaker Block, Fair Value Gap, entry area, stop loss, and take-profit level.
Trade Outcome
As we can see in the image above, price returned to the area where the Breaker Block and Fair Value Gap overlap, triggering our entry. Price then moved decisively to the downside and reached our take-profit target at a 1:2 risk-to-reward ratio.
This example shows how we can combine a higher-timeframe Point of Interest with a lower-timeframe Unicorn Model to identify a potential trade opportunity.
Youtube Video


Read all
PREVIOUS
SMT Divergence
PREVIOUS
SMT Divergence
NEXT
Introduction to Internal and External Liquidity
Read all

Free market insights and exclusive updates, straight to your inbox.
No spam. We hate it as much as you do.
Copyright © 2025 ChartTactix. All rights reserved.
Free market insights and exclusive updates, straight to your inbox.
No spam. We hate it as much as you do.
Copyright © 2025 ChartTactix. All rights reserved.
Copyright © 2025 ChartTactix. All rights reserved.
Market insights and exclusive updates.
No spam. We hate it as much as you do.
Copyright © 2025 ChartTactix. All rights reserved.
Market insights and exclusive updates.
No spam. We hate it as much as you do.