
My Favourite Entry Confirmation
My Favourite Entry Confirmation
Liquidity Sweep → Market Structure Shift → Fair Value Gap
Liquidity Sweep → Market Structure Shift → Fair Value Gap

Bullish Formation
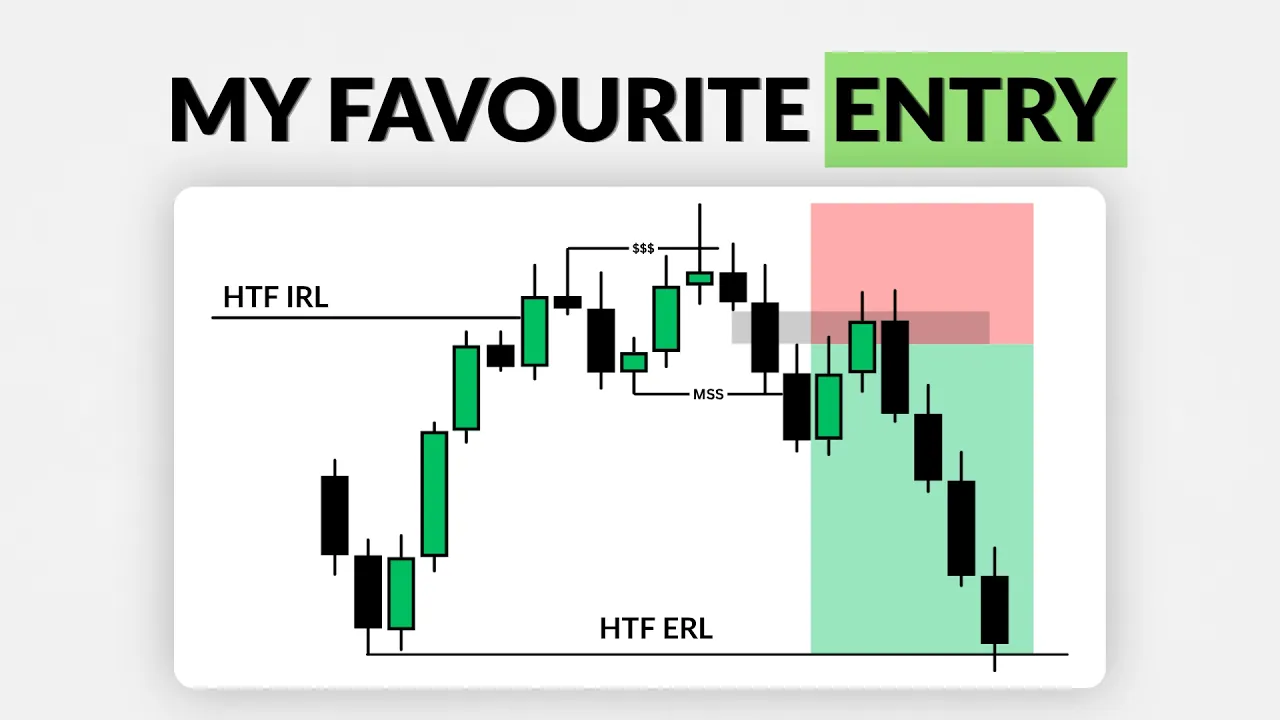
The entry I'm talking about here is one of my favorite entry models because of the context surrounding the setup. It combines a liquidity sweep, a market structure shift, and a fair value gap to give us a structured way of looking for an entry.
For a bullish setup, the first thing I want to see is price sweep a low. Ideally, price wicks below the low without closing below it. Once that liquidity has been taken, I want to see an impulsive move away from that level that shifts market structure.

Once the structure has shifted, I then look at the leg that created that shift. If that move leaves behind a fair value gap, that FVG becomes the area where I look to take my trade. Rather than chasing the impulsive move, I wait for price to retrace back into the fair value gap. The stop loss is placed beyond the swing low, while the target is based on a 1:2 risk-to-reward ratio. The concept itself is simple: liquidity is taken, structure shifts, price leaves an FVG, and we wait for the retracement.

Out & In Candle
There is also another way I like to identify the liquidity sweep, which I call the Out-and-In Candle. In this case, instead of price simply wicking below the low, price closes below the low, but the very next candle closes back above it.
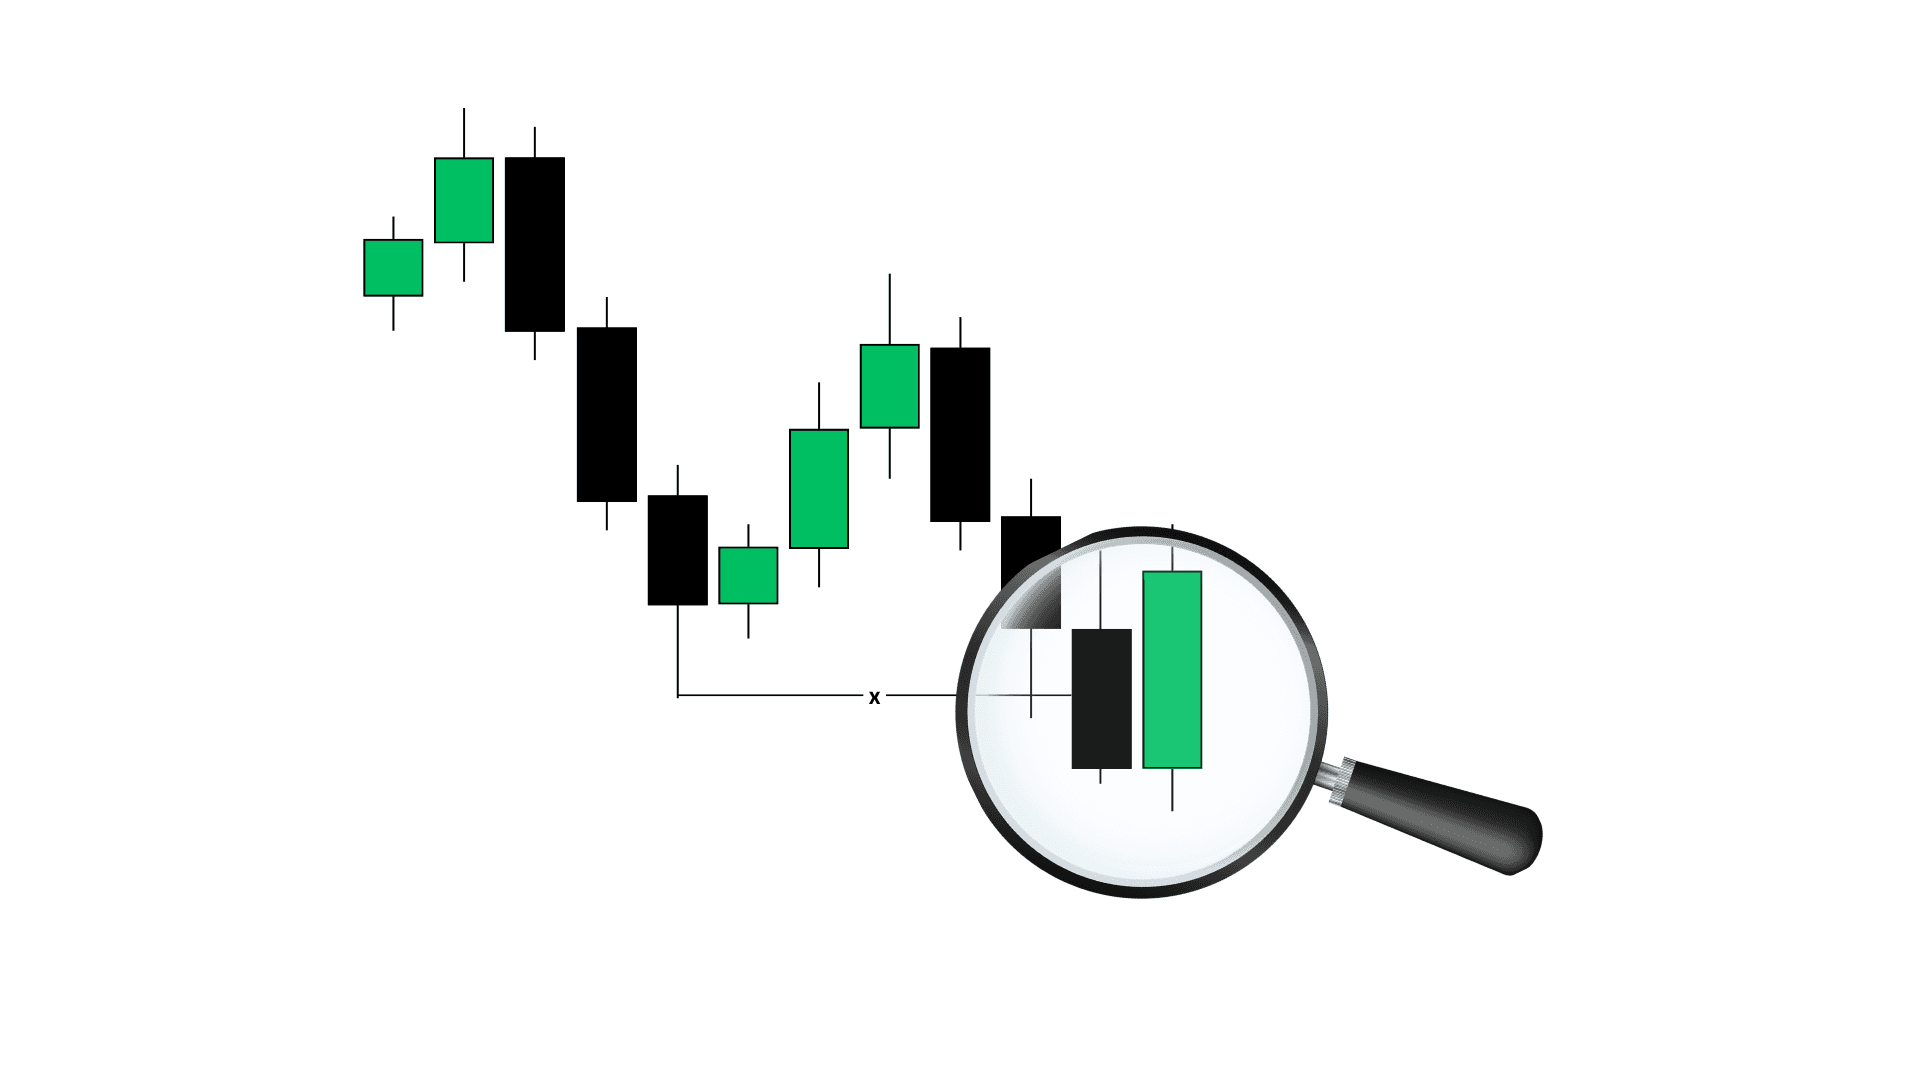
Once I see that out-and-in behavior, I still want the same type of confirmation that follows the sweep. I wait for an impulsive move that shifts structure, identify the fair value gap created during that move, and then wait for price to return to the FVG before looking for the entry.

W Formation
When looking for a liquidity sweep in a bullish scenario, another formation I pay attention to is the W formation. I like to see price create this type of structure around the liquidity before moving higher. When this develops inside a meaningful higher-timeframe point of interest, it can provide additional context to the setup.
In the first example, price takes the liquidity but does not form the W structure.

In this example, you can see the W formation much more clearly. This is the type of formation I'm looking for when the market gives me this particular setup.

But this entry model is not something I simply search for randomly on a chart. Context comes first. I need to have a meaningful higher-timeframe point of interest before looking for the entry confirmation.
Bearish Formation
This is simply the opposite of how the bullish formation occurs.
First, you want to see a liquidity sweep of a swing high. The sweep should ideally be a wick, meaning price should trade above the level but should not close above it.
After the sweep, you want to see an impulsive market structure shift to the downside. The displacement should leave behind a Fair Value Gap, which becomes the area where you look to take your entry.
The stop loss is placed at the relevant swing high, while the target is set at a 1:2 risk-to-reward ratio.

The only exception to the typical wick sweep is an Out-and-In Candle. In this case, price closes above the swing high, but the following candle immediately closes back below it. Once this happens, you then wait for the impulsive market structure shift and the Fair Value Gap before looking for the entry.

M Formation
Another formation to pay attention to when looking for a bearish setup is the M formation.
Ideally, the M formation should develop inside a higher-timeframe Internal Range Liquidity. This gives the setup additional context and can increase the probability of the bearish move playing out.
If the expected M formation does not develop within the higher-timeframe area of interest, there is no need to force the setup. Wait for the right formation and the right context.

Timeframe Alignment
The timeframe I use for the entry also depends on the timeframe of my point of interest. When I have a Daily point of interest, I look for my entry on the 1-hour timeframe. For a 4-hour point of interest, I move down to the 15-minute timeframe, and for a 1-hour point of interest, I use the 5-minute timeframe.

This is important because the liquidity sweep, market structure shift, and fair value gap are entry confirmations. They are not the reason I take a trade by themselves. The higher-timeframe point of interest provides the context, while the lower-timeframe setup gives me the confirmation I'm looking for.
And that's what makes this one of my favorite ways to enter a trade.
Higher-timeframe context. Liquidity. Displacement. Structure shift. Fair value gap. Retracement. Entry.
Simple, structured, and repeatable.
Watch YouTube Video
Bullish Formation
The entry I'm talking about here is one of my favorite entry models because of the context surrounding the setup. It combines a liquidity sweep, a market structure shift, and a fair value gap to give us a structured way of looking for an entry.
For a bullish setup, the first thing I want to see is price sweep a low. Ideally, price wicks below the low without closing below it. Once that liquidity has been taken, I want to see an impulsive move away from that level that shifts market structure.
Once the structure has shifted, I then look at the leg that created that shift. If that move leaves behind a fair value gap, that FVG becomes the area where I look to take my trade. Rather than chasing the impulsive move, I wait for price to retrace back into the fair value gap. The stop loss is placed beyond the swing low, while the target is based on a 1:2 risk-to-reward ratio. The concept itself is simple: liquidity is taken, structure shifts, price leaves an FVG, and we wait for the retracement.
Out & In Candle
There is also another way I like to identify the liquidity sweep, which I call the Out-and-In Candle. In this case, instead of price simply wicking below the low, price closes below the low, but the very next candle closes back above it.
Once I see that out-and-in behavior, I still want the same type of confirmation that follows the sweep. I wait for an impulsive move that shifts structure, identify the fair value gap created during that move, and then wait for price to return to the FVG before looking for the entry.
W Formation
When looking for a liquidity sweep in a bullish scenario, another formation I pay attention to is the W formation. I like to see price create this type of structure around the liquidity before moving higher. When this develops inside a meaningful higher-timeframe point of interest, it can provide additional context to the setup.
In the first example, price takes the liquidity but does not form the W structure.
In this example, you can see the W formation much more clearly. This is the type of formation I'm looking for when the market gives me this particular setup.
But this entry model is not something I simply search for randomly on a chart. Context comes first. I need to have a meaningful higher-timeframe point of interest before looking for the entry confirmation.
Bearish Formation
This is simply the opposite of how the bullish formation occurs.
First, you want to see a liquidity sweep of a swing high. The sweep should ideally be a wick, meaning price should trade above the level but should not close above it.
After the sweep, you want to see an impulsive market structure shift to the downside. The displacement should leave behind a Fair Value Gap, which becomes the area where you look to take your entry.
The stop loss is placed at the relevant swing high, while the target is set at a 1:2 risk-to-reward ratio.
The only exception to the typical wick sweep is an Out-and-In Candle. In this case, price closes above the swing high, but the following candle immediately closes back below it. Once this happens, you then wait for the impulsive market structure shift and the Fair Value Gap before looking for the entry.
M Formation
Another formation to pay attention to when looking for a bearish setup is the M formation.
Ideally, the M formation should develop inside a higher-timeframe Internal Range Liquidity. This gives the setup additional context and can increase the probability of the bearish move playing out.
If the expected M formation does not develop within the higher-timeframe area of interest, there is no need to force the setup. Wait for the right formation and the right context.
Timeframe Alignment
The timeframe I use for the entry also depends on the timeframe of my point of interest. When I have a Daily point of interest, I look for my entry on the 1-hour timeframe. For a 4-hour point of interest, I move down to the 15-minute timeframe, and for a 1-hour point of interest, I use the 5-minute timeframe.
This is important because the liquidity sweep, market structure shift, and fair value gap are entry confirmations. They are not the reason I take a trade by themselves. The higher-timeframe point of interest provides the context, while the lower-timeframe setup gives me the confirmation I'm looking for.
And that's what makes this one of my favorite ways to enter a trade.
Higher-timeframe context. Liquidity. Displacement. Structure shift. Fair value gap. Retracement. Entry.
Simple, structured, and repeatable.
Watch YouTube Video


Read all

Free market insights and exclusive updates, straight to your inbox.
No spam. We hate it as much as you do.
Copyright © 2025 ChartTactix. All rights reserved.
Free market insights and exclusive updates, straight to your inbox.
No spam. We hate it as much as you do.
Copyright © 2025 ChartTactix. All rights reserved.
Copyright © 2025 ChartTactix. All rights reserved.
Market insights and exclusive updates.
No spam. We hate it as much as you do.
Copyright © 2025 ChartTactix. All rights reserved.
Market insights and exclusive updates.
No spam. We hate it as much as you do.