
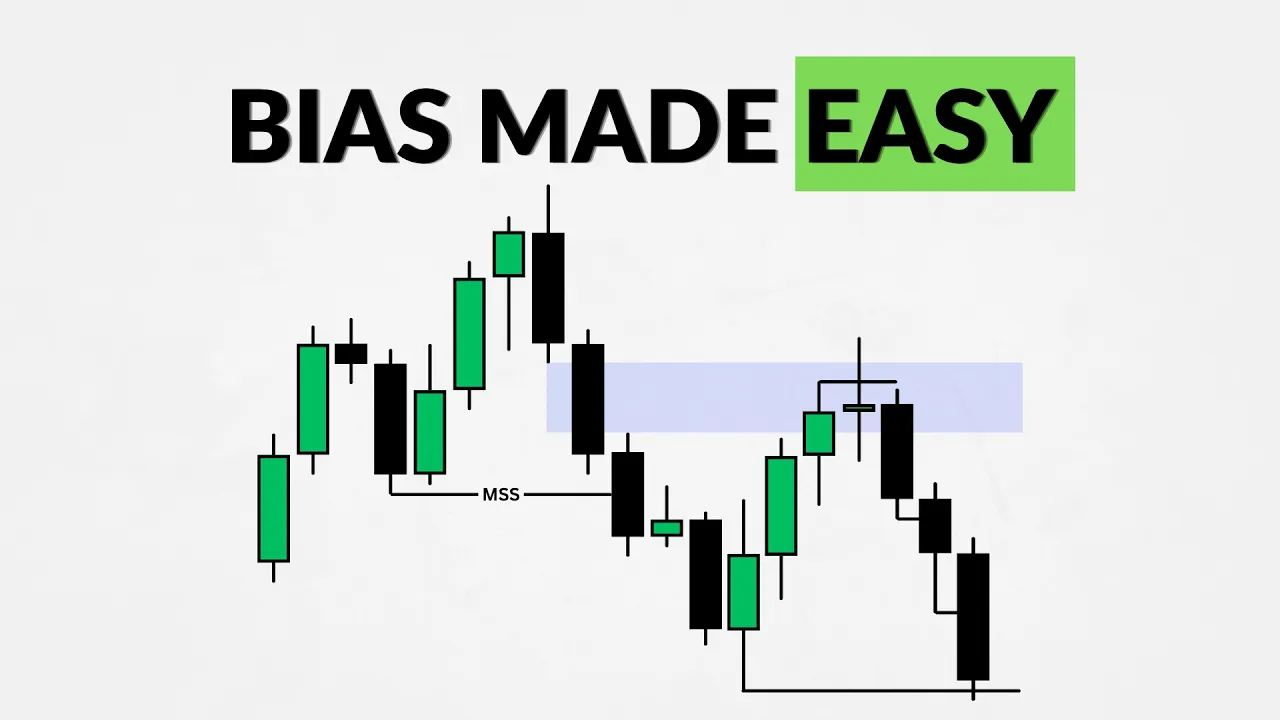
Mastering the Daily Bias
Mastering the Daily Bias
How to Accurately Predict Bias
How to Accurately Predict Bias

Concepts for Determining Bias
There are two key concepts that can be used to determine bias:
1) Internal Range Liquidity → External Range Liquidity
2) Candle Science
Internal Range Liquidity to External Range Liquidity
Internal Range Liquidity and External Range Liquidity can be used to identify where price is most likely to move next.
When price is trading within Internal Range Liquidity, the expectation is for price to seek External Range Liquidity.
Likewise, when price reaches External Range Liquidity, the expectation shifts toward a potential move back into Internal Range Liquidity.

Candle Science
Candle Science involves studying the previous candle's high and low and observing how price interacts with those levels to form an expectation for the following candle.
There are two bullish and two bearish scenarios to understand.
Bullish Candle Science
If price sweeps the previous candle's low and closes back above it, bullish price action can be anticipated for the following day.

If price closes above the previous candle's high, bullish price action can also be anticipated for the following day.

Bearish Candle Science
If price closes below the previous candle's low, bearish price action can be anticipated for the following day.

If price sweeps the previous candle's high and closes back below it, bearish price action can also be anticipated for the following day.

Putting Bias Into Practice
Let's use the example below to see how bias can play out in the market.
Here, price gives us a Candle Sweep, which provides a bearish expectation. With this bearish bias, the lows of the previous candles become our immediate Draw on Liquidity.

Price then moves lower and takes out those levels. After doing so, it closes below the previous candle's low, which gives us another reason to maintain the bearish expectation. The next Draw on Liquidity now becomes the low of the previous candle.
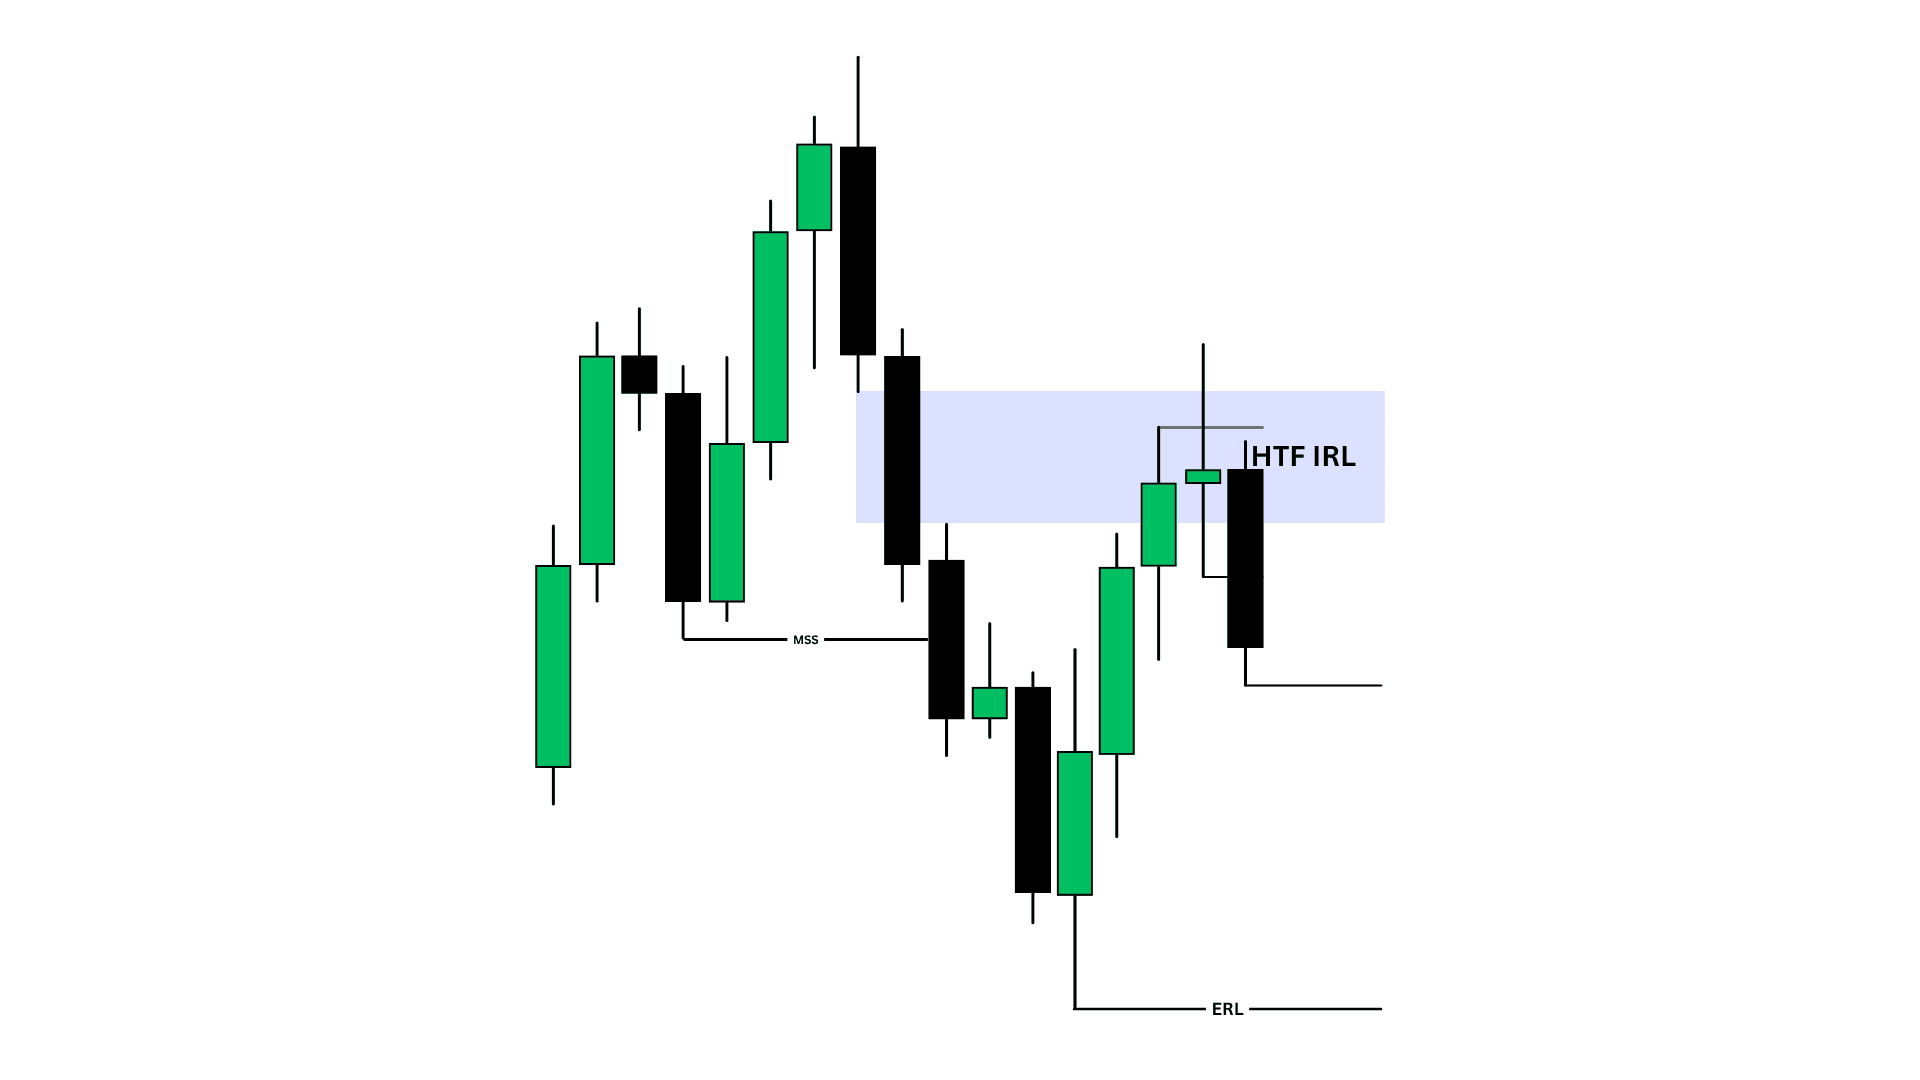
Price then closes below the previous candle's low once again, giving us another bearish indication. As a result, the next lower liquidity level becomes the new Draw on Liquidity.

Eventually, price reaches and takes out the External Range Liquidity, which was the overall Draw on Liquidity.
At this point, the original bearish objective has been reached. Rather than continuing to force a bearish bias, we become neutral and wait to see how price reacts around the External Range Liquidity. From there, the market can provide information that helps determine whether the bearish move will continue or whether a bullish reversal is developing.
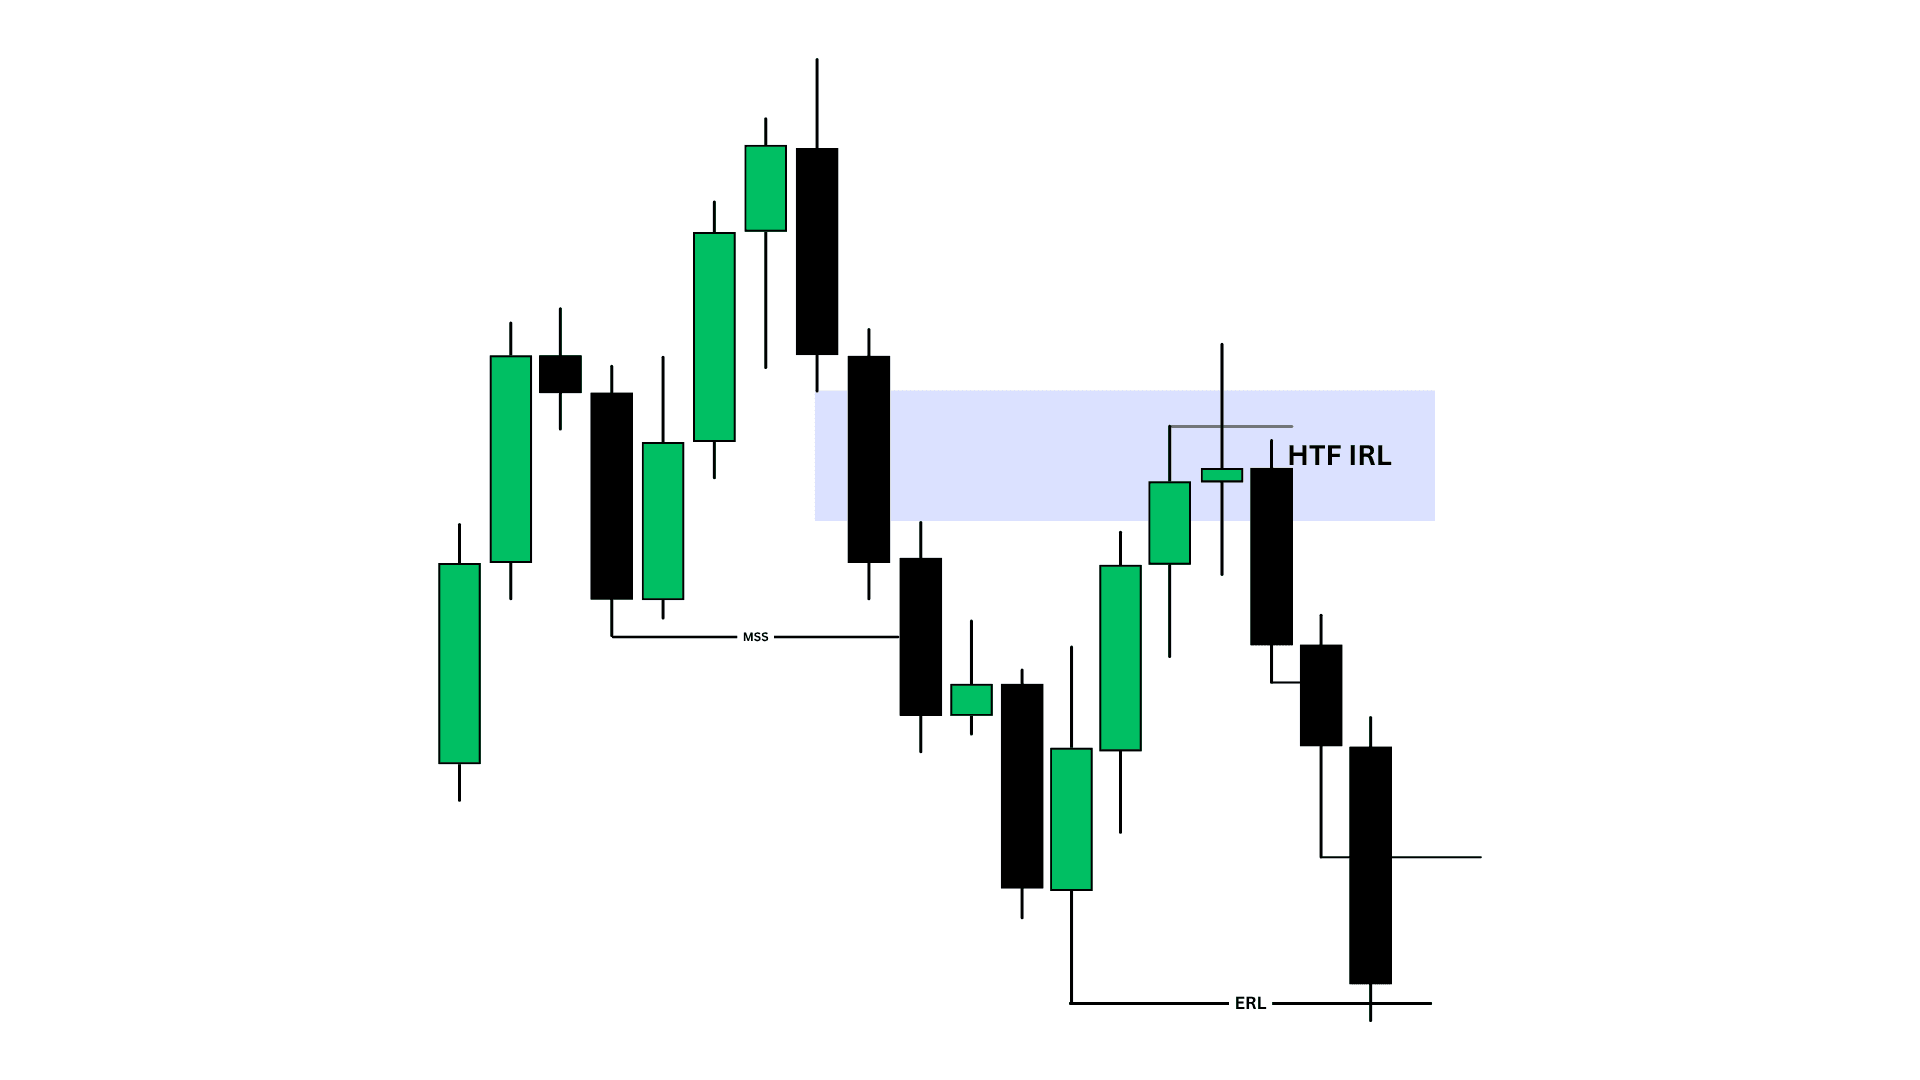
This is the key idea: the Draw on Liquidity can change as price reaches each objective, while the overall bias remains valid until the larger objective is reached or the market gives a reason to invalidate it.
Watch Full Video on Youtube
Concepts for Determining Bias
There are two key concepts that can be used to determine bias:
1) Internal Range Liquidity → External Range Liquidity
2) Candle Science
Internal Range Liquidity to External Range Liquidity
Internal Range Liquidity and External Range Liquidity can be used to identify where price is most likely to move next.
When price is trading within Internal Range Liquidity, the expectation is for price to seek External Range Liquidity.
Likewise, when price reaches External Range Liquidity, the expectation shifts toward a potential move back into Internal Range Liquidity.
Candle Science
Candle Science involves studying the previous candle's high and low and observing how price interacts with those levels to form an expectation for the following candle.
There are two bullish and two bearish scenarios to understand.
Bullish Candle Science
If price sweeps the previous candle's low and closes back above it, bullish price action can be anticipated for the following day.
If price closes above the previous candle's high, bullish price action can also be anticipated for the following day.
Bearish Candle Science
If price closes below the previous candle's low, bearish price action can be anticipated for the following day.
If price sweeps the previous candle's high and closes back below it, bearish price action can also be anticipated for the following day.
Putting Bias Into Practice
Let's use the example below to see how bias can play out in the market.
Here, price gives us a Candle Sweep, which provides a bearish expectation. With this bearish bias, the lows of the previous candles become our immediate Draw on Liquidity.
Price then moves lower and takes out those levels. After doing so, it closes below the previous candle's low, which gives us another reason to maintain the bearish expectation. The next Draw on Liquidity now becomes the low of the previous candle.
Price then closes below the previous candle's low once again, giving us another bearish indication. As a result, the next lower liquidity level becomes the new Draw on Liquidity.
Eventually, price reaches and takes out the External Range Liquidity, which was the overall Draw on Liquidity.
At this point, the original bearish objective has been reached. Rather than continuing to force a bearish bias, we become neutral and wait to see how price reacts around the External Range Liquidity. From there, the market can provide information that helps determine whether the bearish move will continue or whether a bullish reversal is developing.
This is the key idea: the Draw on Liquidity can change as price reaches each objective, while the overall bias remains valid until the larger objective is reached or the market gives a reason to invalidate it.
Watch Full Video on Youtube


Read all

Free market insights and exclusive updates, straight to your inbox.
No spam. We hate it as much as you do.
Copyright © 2025 ChartTactix. All rights reserved.
Free market insights and exclusive updates, straight to your inbox.
No spam. We hate it as much as you do.
Copyright © 2025 ChartTactix. All rights reserved.
Copyright © 2025 ChartTactix. All rights reserved.
Market insights and exclusive updates.
No spam. We hate it as much as you do.
Copyright © 2025 ChartTactix. All rights reserved.
Market insights and exclusive updates.
No spam. We hate it as much as you do.