
SMT Divergence
SMT Divergence
Understanding Correlation, Market Divergence, and How to Use SMT for Trade Confirmations
Understanding Correlation, Market Divergence, and How to Use SMT for Trade Confirmations

Introduction
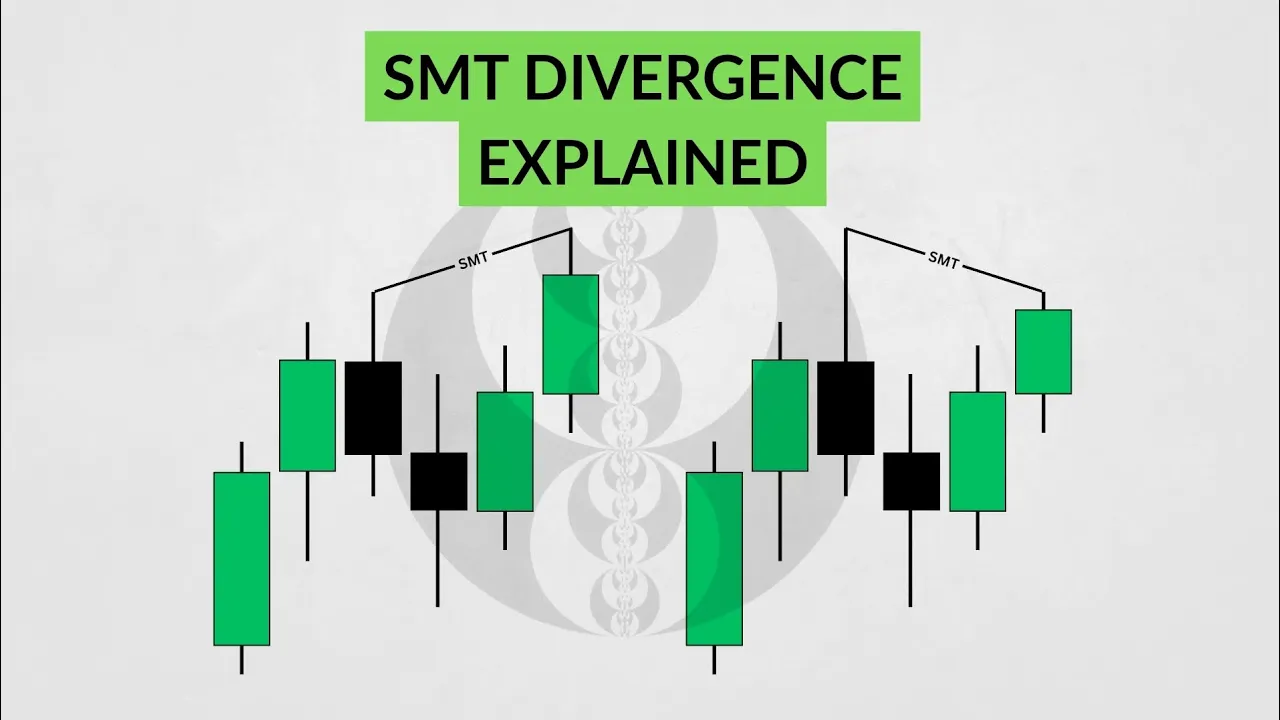
SMT divergence occurs when two correlated assets or currency pairs stop making corresponding price movements. In simple terms, one asset makes a new high or low, while the other fails to do so.
SMT stands for Smart Money Technique. It is a concept used in ICT trading to compare the price movements of related markets and identify potential weaknesses in the current direction of price.
Some examples of commonly compared assets include:
EUR/USD and GBP/USD
AUD/USD and NZD/USD
Gold and silver
EUR/JPY and GBP/JPY
EUR/USD and the US Dollar Index (DXY)
Nasdaq and S&P 500
There are many other assets that traders compare when looking for SMT divergence but these are the main ones.
Understanding the Two Types of Correlation
Before you can understand SMT divergence, you first need to understand the two types of correlation: positive correlation and negative correlation.
Positive Correlation
Positive correlation occurs when two assets tend to move in the same direction.
For example, EUR/USD and GBP/USD often move similarly. When EUR/USD is creating lower highs and lower lows, GBP/USD will also be creating lower highs and lower lows.

Negative Correlation
Negative correlation occurs when two assets tend to move similarly but in opposite directions.
A common example is EUR/USD and the US Dollar Index (DXY).
For example, when EUR/USD is creating lower highs and lower lows, DXY will be creating higher highs and higher lows.

How Does SMT Divergence Form?
Now that you understand correlation, let's look at how SMT divergence forms.
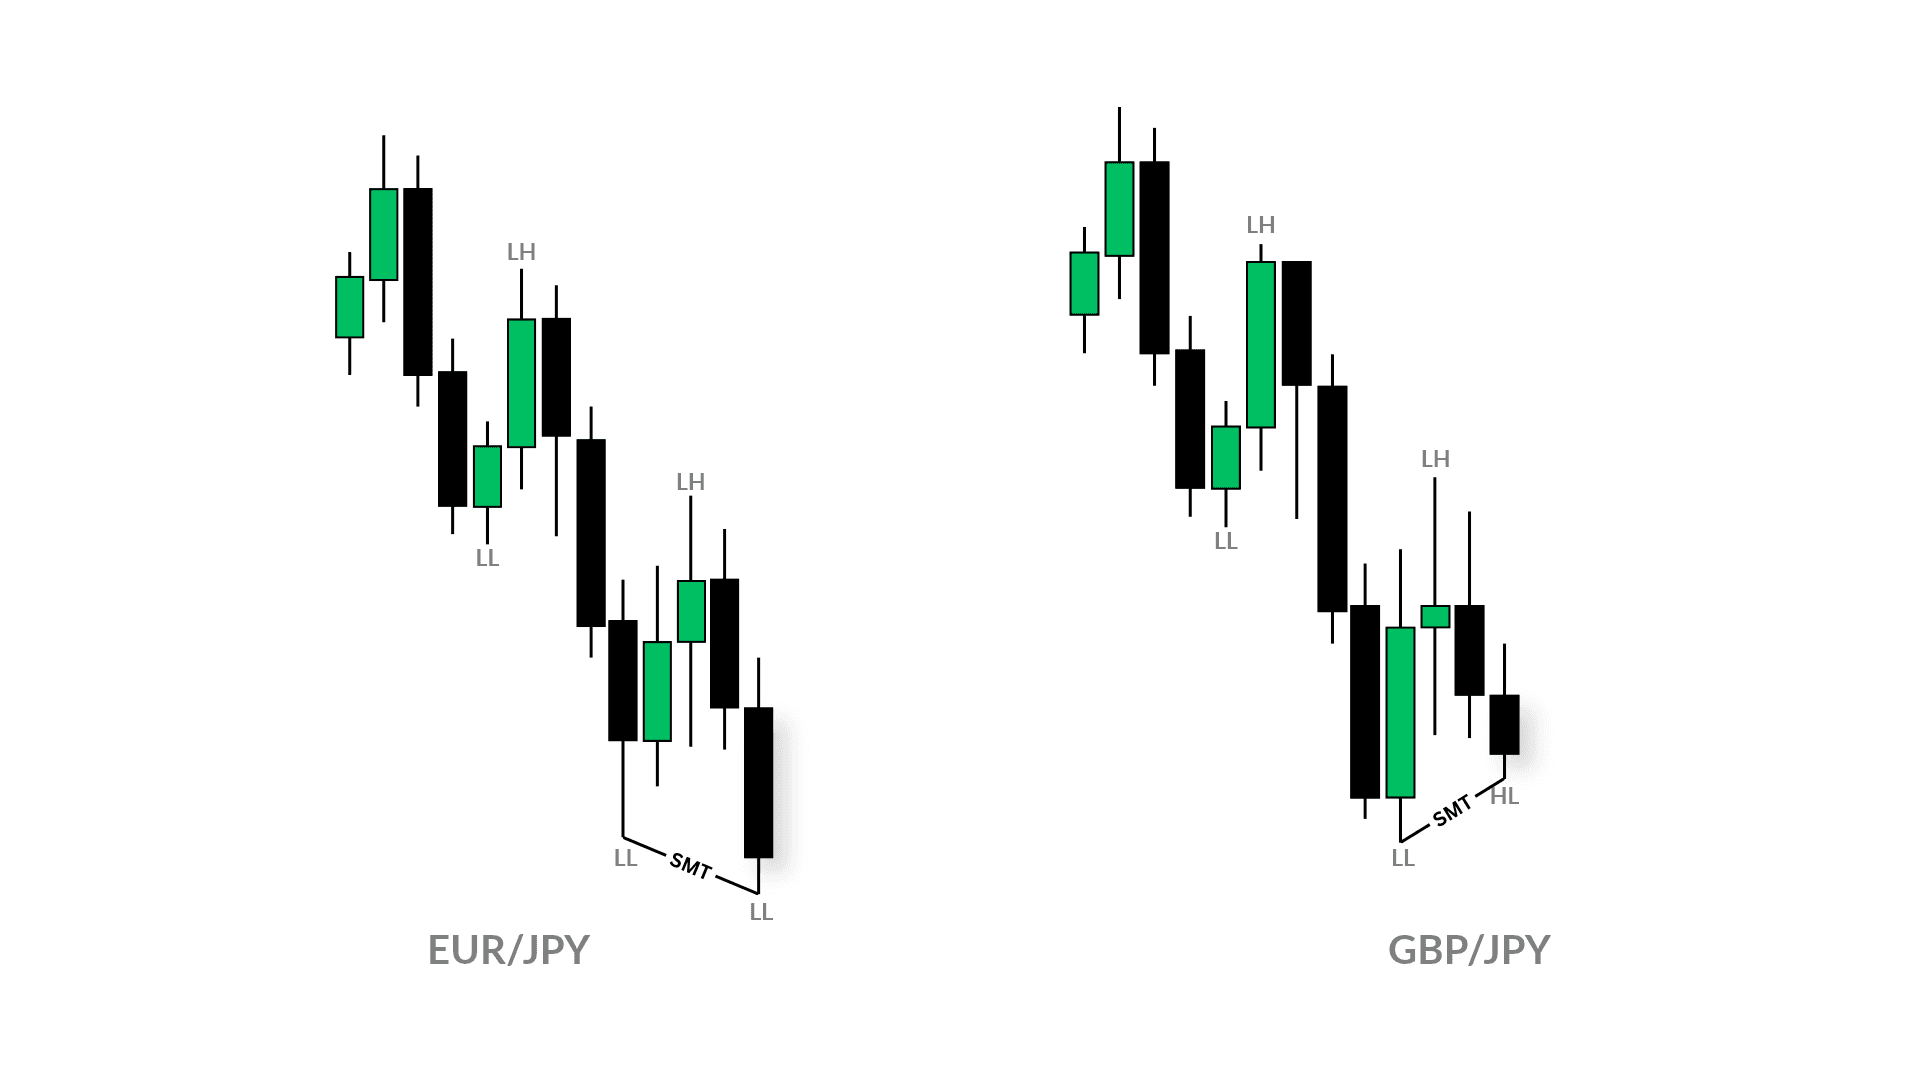
For example, let's say EUR/JPY and GBP/JPY are both moving lower and creating lower highs and lower lows.
Eventually, EUR/JPY takes out its previous low and creates a new lower low. However, GBP/JPY fails to take out its corresponding low.
This difference between the two pairs is an example of SMT divergence. It suggests that the selling pressure may not be as consistent across both markets.
SMT Divergence Between Negatively Correlated Assets
SMT divergence can also form between negatively correlated assets, such as EUR/USD and DXY.
Since these assets often move in opposite directions, when EUR/USD creates a new lower low, we would generally expect DXY to create a corresponding higher high.
However, if EUR/USD makes a new lower low while DXY fails to make a new higher high, this difference can indicate SMT divergence.
The same principle applies in the opposite direction. If EUR/USD creates a new higher high but DXY fails to create a corresponding lower low, that can also indicate SMT divergence.

Why Does SMT Divergence Matter?
SMT divergence helps traders compare the strength of price movements across related markets.
When one asset continues making new highs or lows while the other fails to follow, it may suggest that the current move is losing consistency or that the two markets are showing different levels of strength.
This can provide an early warning of a potential reversal, particularly when the divergence forms around an important area of liquidity or a higher-timeframe Point of Interest (POI).
However, SMT divergence does not automatically mean that price is about to reverse. Sometimes, the assets will resume moving in alignment, and the market will continue in its original direction.
This is why SMT divergence should not be used in isolation. You need additional confirmation before considering a trade.
How to Trade SMT Divergence
There are different ways to use SMT divergence in your trading. Here are two approaches.
Using SMT Divergence as a Lower-Timeframe Confirmation
One way to use SMT divergence is as a lower-timeframe confirmation when price reaches a higher-timeframe Point of Interest.
For example, let's say price is approaching a higher-timeframe bullish POI. Based on your analysis, you anticipate that price could reverse to the upside once it reaches that area.

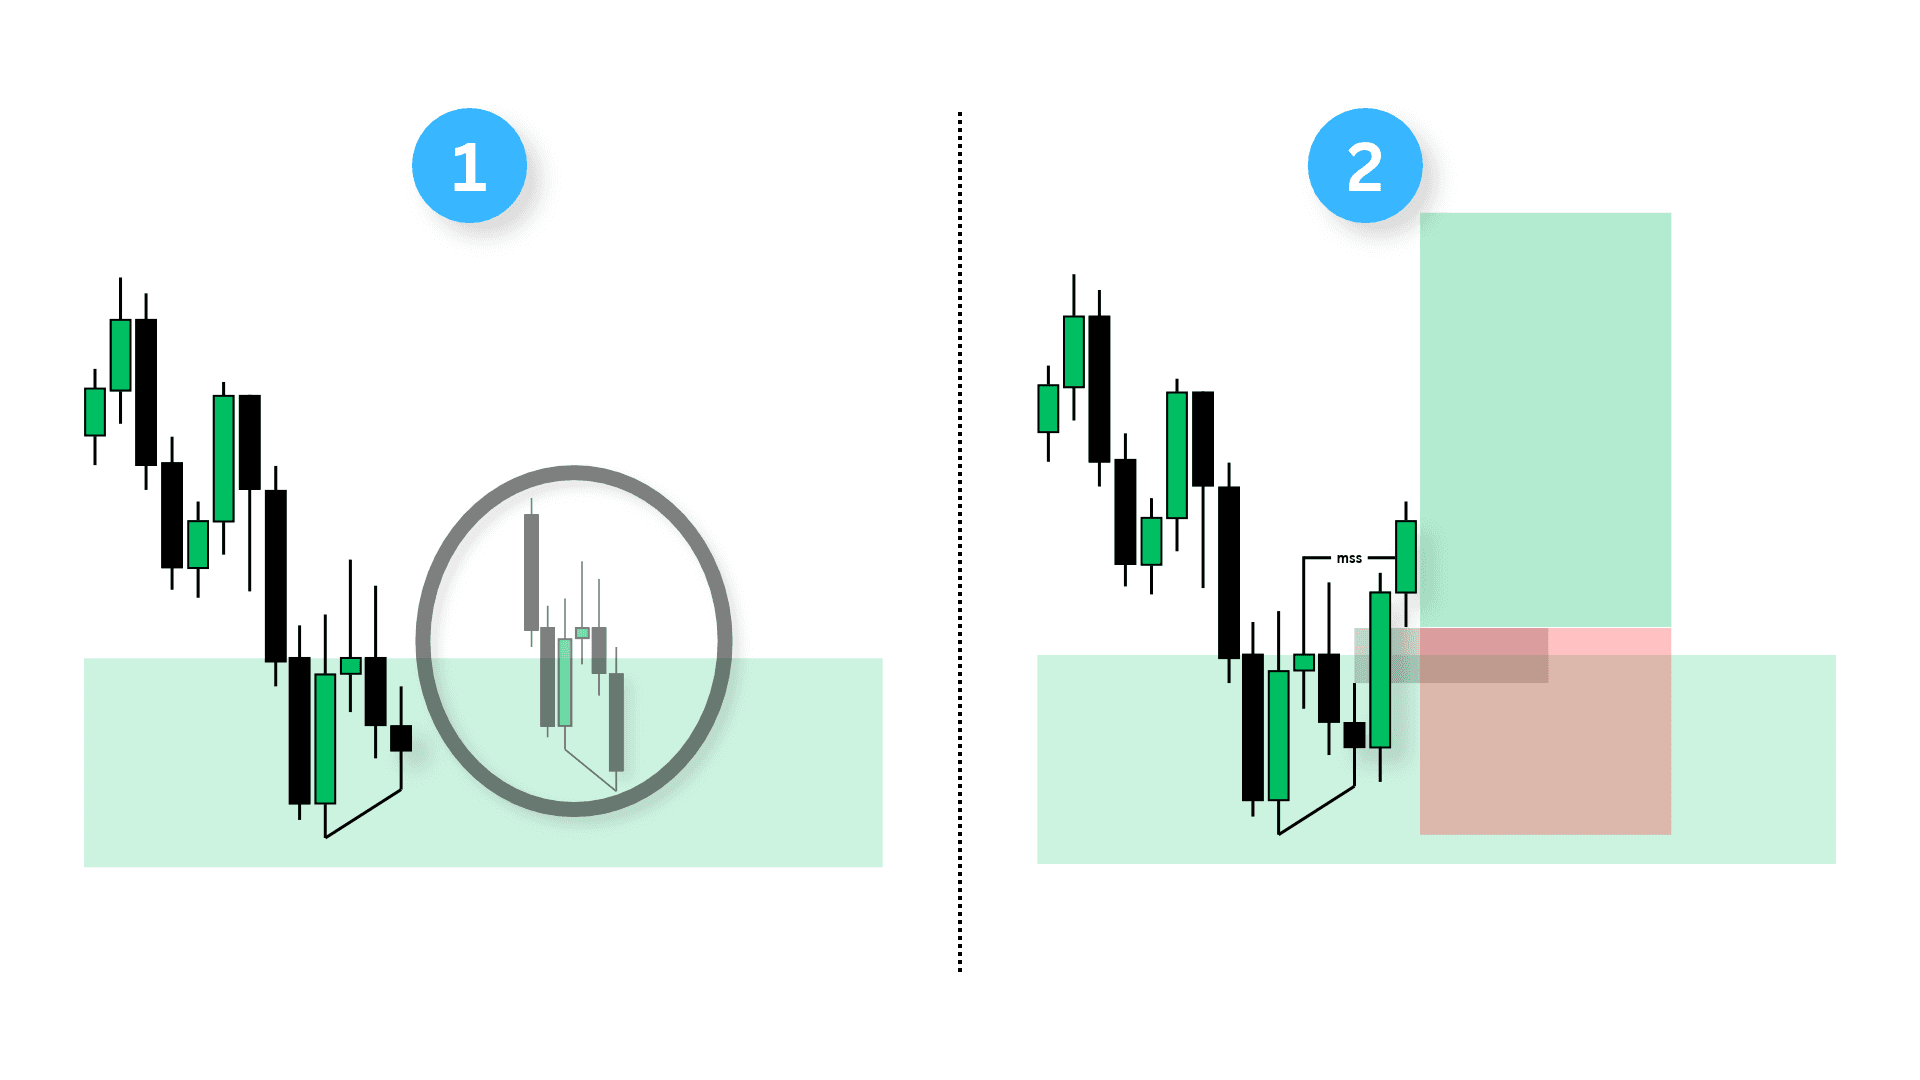
Instead of entering immediately, you can drop to a lower timeframe and compare two correlated pairs. If one pair sweeps a previous low while the other fails to make a corresponding lower low, you may have a bullish SMT divergence.
This gives you additional information about how the two markets are behaving around your POI.
However, you should still wait for further confirmation. You could look for an engulfing candle, strong displacement, a Market Structure Shift (MSS), or a new Fair Value Gap (FVG).
Once the confirmation forms, you can use the resulting price action to identify a potential entry and define where your trade idea would be invalidated.
The opposite applies to bearish setups, where you look for bearish SMT divergence around a higher-timeframe bearish POI, followed by bearish confirmation.
Using SMT Divergence After a Liquidity Sweep
Another way to trade SMT divergence is to look for it after price sweeps a swing high or swing low.
For example, when price sweeps a significant swing high, you may anticipate a potential bearish reversal.

You can then drop to a lower timeframe and compare two correlated pairs.
If one pair sweeps its previous high while the other fails to do so, this can provide additional confluence for a potential bearish reversal.
From there, you can wait for a Market Structure Shift, strong displacement, or a Fair Value Gap to form before looking for an entry.

The same concept applies to bullish setups. After price sweeps a significant swing low, you can look for bearish SMT divergence on a lower timeframe and then wait for bullish confirmation before considering a trade.
The key is to combine the liquidity sweep, SMT divergence, and price-action confirmation rather than relying on the divergence alone.
Final Thoughts
SMT divergence is a useful concept for comparing related markets and identifying situations where their price movements no longer align.
However, the goal is not to trade every divergence you see. Focus on divergences that form around meaningful areas, such as higher-timeframe Points of Interest and important liquidity levels.
When SMT divergence aligns with your market analysis and is followed by clear price-action confirmation, it can help you build a more structured trading setup.
Remember, SMT divergence is a confluence, not a guarantee of reversal. Always define your risk and wait for the market to provide the confirmation your trading plan requires.
Youtube Video
Introduction
SMT divergence occurs when two correlated assets or currency pairs stop making corresponding price movements. In simple terms, one asset makes a new high or low, while the other fails to do so.
SMT stands for Smart Money Technique. It is a concept used in ICT trading to compare the price movements of related markets and identify potential weaknesses in the current direction of price.
Some examples of commonly compared assets include:
EUR/USD and GBP/USD
AUD/USD and NZD/USD
Gold and silver
EUR/JPY and GBP/JPY
EUR/USD and the US Dollar Index (DXY)
Nasdaq and S&P 500
There are many other assets that traders compare when looking for SMT divergence but these are the main ones.
Understanding the Two Types of Correlation
Before you can understand SMT divergence, you first need to understand the two types of correlation: positive correlation and negative correlation.
Positive Correlation
Positive correlation occurs when two assets tend to move in the same direction.
For example, EUR/USD and GBP/USD often move similarly. When EUR/USD is creating lower highs and lower lows, GBP/USD will also be creating lower highs and lower lows.
Negative Correlation
Negative correlation occurs when two assets tend to move similarly but in opposite directions.
A common example is EUR/USD and the US Dollar Index (DXY).
For example, when EUR/USD is creating lower highs and lower lows, DXY will be creating higher highs and higher lows.
How Does SMT Divergence Form?
Now that you understand correlation, let's look at how SMT divergence forms.
For example, let's say EUR/JPY and GBP/JPY are both moving lower and creating lower highs and lower lows.
Eventually, EUR/JPY takes out its previous low and creates a new lower low. However, GBP/JPY fails to take out its corresponding low.
This difference between the two pairs is an example of SMT divergence. It suggests that the selling pressure may not be as consistent across both markets.
SMT Divergence Between Negatively Correlated Assets
SMT divergence can also form between negatively correlated assets, such as EUR/USD and DXY.
Since these assets often move in opposite directions, when EUR/USD creates a new lower low, we would generally expect DXY to create a corresponding higher high.
However, if EUR/USD makes a new lower low while DXY fails to make a new higher high, this difference can indicate SMT divergence.
The same principle applies in the opposite direction. If EUR/USD creates a new higher high but DXY fails to create a corresponding lower low, that can also indicate SMT divergence.
Why Does SMT Divergence Matter?
SMT divergence helps traders compare the strength of price movements across related markets.
When one asset continues making new highs or lows while the other fails to follow, it may suggest that the current move is losing consistency or that the two markets are showing different levels of strength.
This can provide an early warning of a potential reversal, particularly when the divergence forms around an important area of liquidity or a higher-timeframe Point of Interest (POI).
However, SMT divergence does not automatically mean that price is about to reverse. Sometimes, the assets will resume moving in alignment, and the market will continue in its original direction.
This is why SMT divergence should not be used in isolation. You need additional confirmation before considering a trade.
How to Trade SMT Divergence
There are different ways to use SMT divergence in your trading. Here are two approaches.
Using SMT Divergence as a Lower-Timeframe Confirmation
One way to use SMT divergence is as a lower-timeframe confirmation when price reaches a higher-timeframe Point of Interest.
For example, let's say price is approaching a higher-timeframe bullish POI. Based on your analysis, you anticipate that price could reverse to the upside once it reaches that area.
Instead of entering immediately, you can drop to a lower timeframe and compare two correlated pairs. If one pair sweeps a previous low while the other fails to make a corresponding lower low, you may have a bullish SMT divergence.
This gives you additional information about how the two markets are behaving around your POI.
However, you should still wait for further confirmation. You could look for an engulfing candle, strong displacement, a Market Structure Shift (MSS), or a new Fair Value Gap (FVG).
Once the confirmation forms, you can use the resulting price action to identify a potential entry and define where your trade idea would be invalidated.
The opposite applies to bearish setups, where you look for bearish SMT divergence around a higher-timeframe bearish POI, followed by bearish confirmation.
Using SMT Divergence After a Liquidity Sweep
Another way to trade SMT divergence is to look for it after price sweeps a swing high or swing low.
For example, when price sweeps a significant swing high, you may anticipate a potential bearish reversal.
You can then drop to a lower timeframe and compare two correlated pairs.
If one pair sweeps its previous high while the other fails to do so, this can provide additional confluence for a potential bearish reversal.
From there, you can wait for a Market Structure Shift, strong displacement, or a Fair Value Gap to form before looking for an entry.
The same concept applies to bullish setups. After price sweeps a significant swing low, you can look for bearish SMT divergence on a lower timeframe and then wait for bullish confirmation before considering a trade.
The key is to combine the liquidity sweep, SMT divergence, and price-action confirmation rather than relying on the divergence alone.
Final Thoughts
SMT divergence is a useful concept for comparing related markets and identifying situations where their price movements no longer align.
However, the goal is not to trade every divergence you see. Focus on divergences that form around meaningful areas, such as higher-timeframe Points of Interest and important liquidity levels.
When SMT divergence aligns with your market analysis and is followed by clear price-action confirmation, it can help you build a more structured trading setup.
Remember, SMT divergence is a confluence, not a guarantee of reversal. Always define your risk and wait for the market to provide the confirmation your trading plan requires.
Youtube Video


Read all
PREVIOUS
Breaker Blocks
PREVIOUS
Breaker Blocks
NEXT
Managing Trade Psychology: Overcoming FOMO and Revenge Trading
Read all

Free market insights and exclusive updates, straight to your inbox.
No spam. We hate it as much as you do.
Copyright © 2025 ChartTactix. All rights reserved.
Free market insights and exclusive updates, straight to your inbox.
No spam. We hate it as much as you do.
Copyright © 2025 ChartTactix. All rights reserved.
Copyright © 2025 ChartTactix. All rights reserved.
Market insights and exclusive updates.
No spam. We hate it as much as you do.
Copyright © 2025 ChartTactix. All rights reserved.
Market insights and exclusive updates.
No spam. We hate it as much as you do.