
LIQUIDITY EXPLAINED
LIQUIDITY EXPLAINED
Understanding Buy-Side Liquidity, Sell-Side Liquidity, and Liquidity Sweeps
Understanding Buy-Side Liquidity, Sell-Side Liquidity, and Liquidity Sweeps

What Is Liquidity?
Liquidity refers to the availability of orders in the market. Every buyer needs a seller, and every seller needs a buyer for a transaction to take place.
As traders place their orders, liquidity builds up around certain areas of the chart. These areas become important because many traders tend to place their entry orders and stop losses around the same price levels.
One of the easiest ways to identify these areas is by looking at swing highs and swing lows.

Buy-Side Liquidity (BSL)
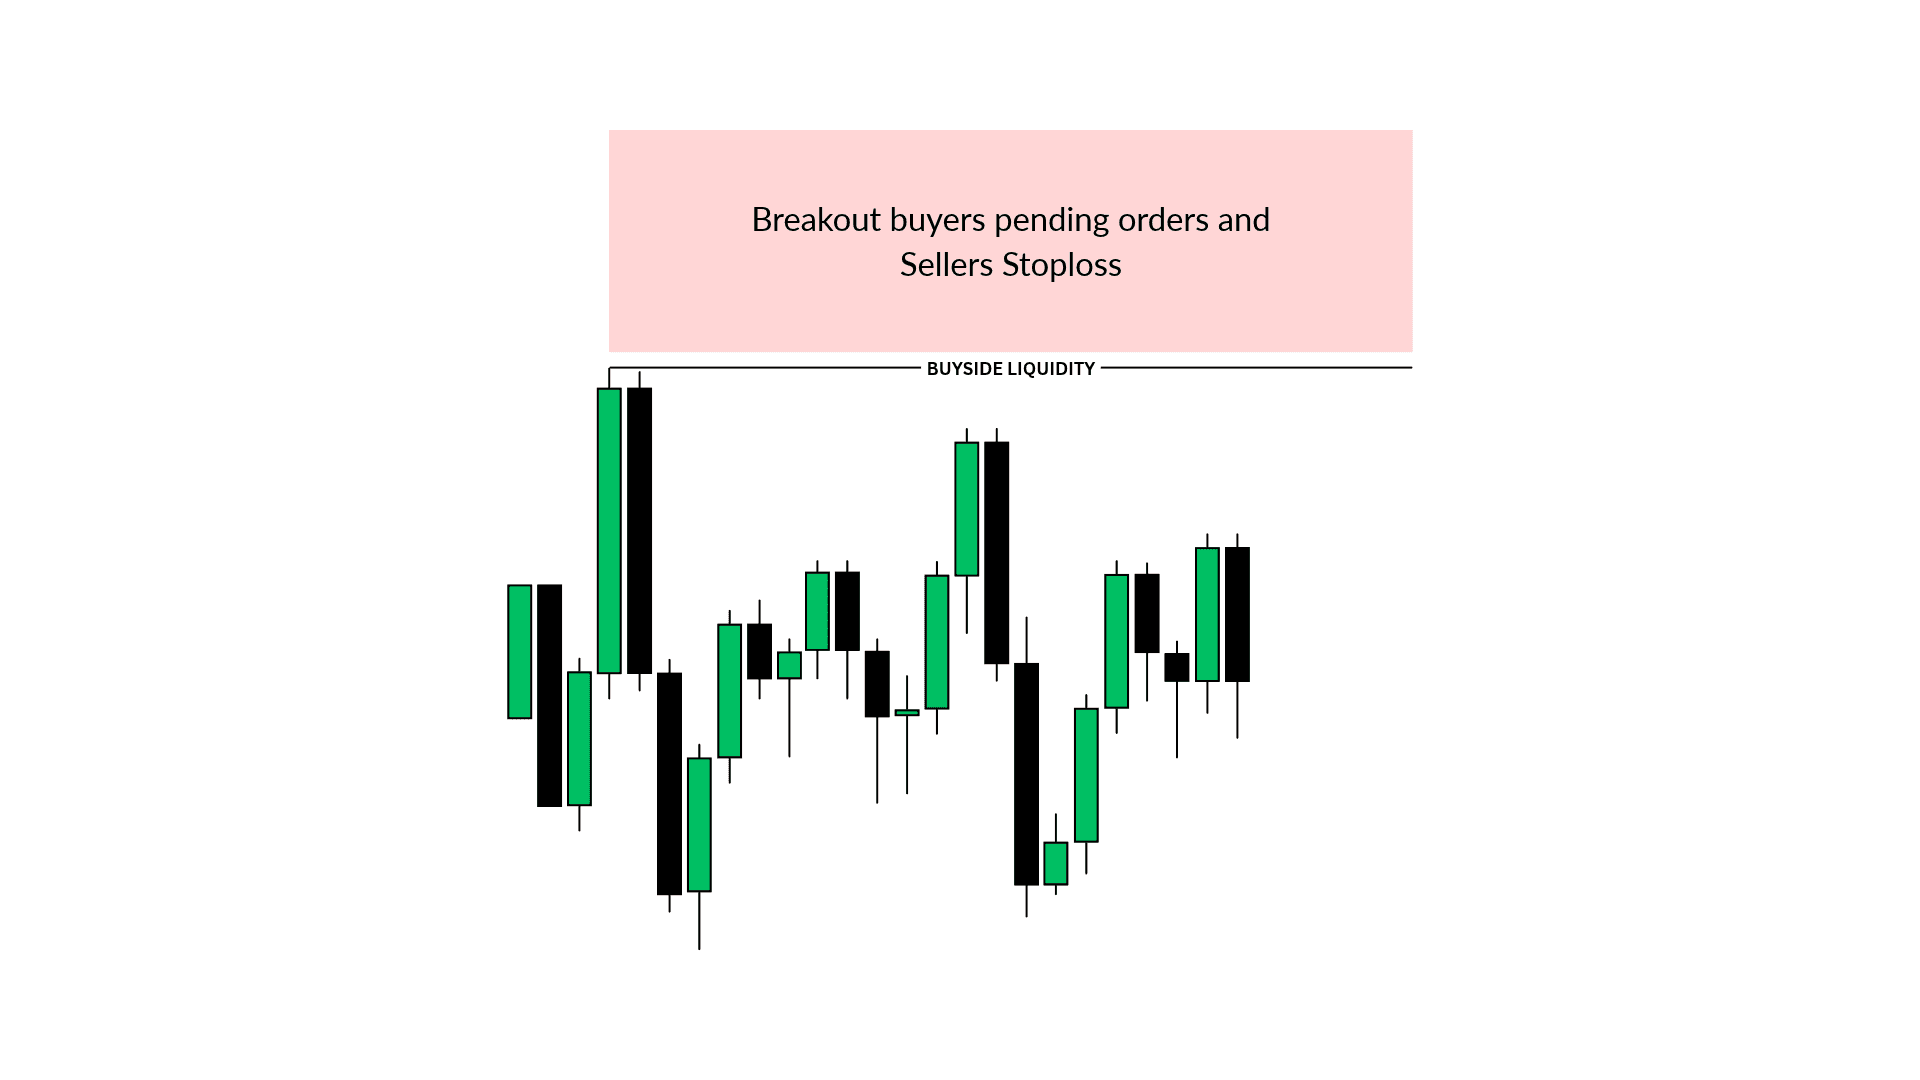
Buy-side liquidity is the liquidity that forms above swing highs.
Why does it form there? Because different traders place their orders around these levels.
For example, breakout traders may place buy-stop orders above a swing high because they want to buy when price breaks above it. Traders who are already in sell positions may also place their stop losses at the same high.
When these orders gather around a similar area, it creates a pool of buy-side liquidity.
Sell-Side Liquidity (SSL)
Sell-side liquidity is the opposite. It forms below swing lows.
Breakout traders may place sell-stop orders below a swing low because they want to sell if price breaks below it. At the same time, traders who are already in buy positions may place their stop losses below that low.
These orders can gather around the same area, creating a pool of sell-side liquidity.

The easiest way to remember the difference is:
Buy-side liquidity: Above the highs.
Sell-side liquidity: Below the lows.
These are important areas to watch because price can move toward them to trigger the orders resting around those levels.
What Is a Liquidity Sweep?
Now that you understand where liquidity forms, let's talk about the liquidity sweep.
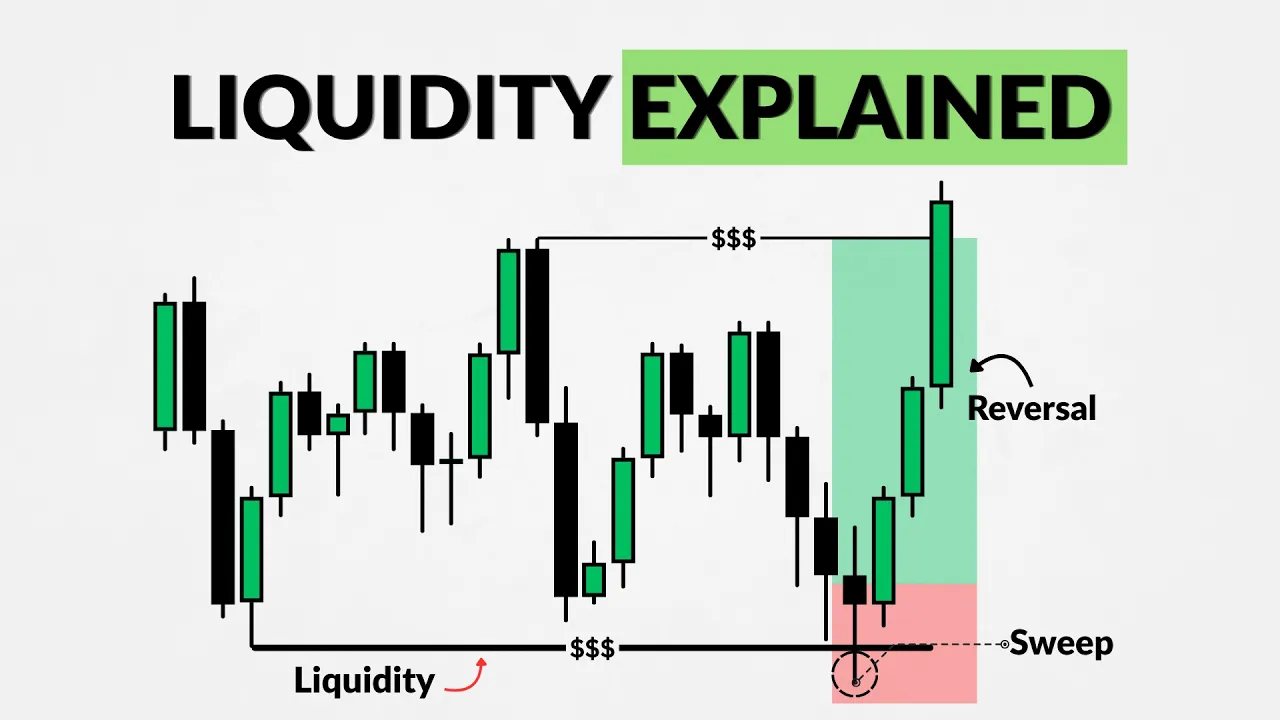
A liquidity sweep happens when price moves beyond a swing high or swing low, takes out the liquidity around that level, and then reverses back across it.
For example, price may move above a swing high, trigger the buy-side liquidity resting above it, and then reverse aggressively to the downside.
This can trap traders who bought the breakout, while also triggering the stop losses of traders who were already selling.

The same thing can happen below a swing low. Price moves below the low, takes out the sell-side liquidity, and then reverses higher.

This is why liquidity sweeps are important in ICT. They help you identify situations where price takes liquidity on one side of the market before potentially moving in the opposite direction.
However, the sweep itself is not an entry signal. After a sweep, you still want to see how price reacts. An impulsive move away from the level and a market structure shift can provide additional confirmation before looking for an entry.
Liquidity Sweep vs Breakout: How Do You Tell the Difference?
One important thing to understand is that not every move above a swing high or below a swing low is a liquidity sweep. Sometimes price is simply breaking out and continuing in the same direction.
So, how do you tell the difference?
The first thing to look at is how price approaches the level and what happens after it breaks through.
When price approaches a level and then briefly moves beyond it before quickly reversing back inside the previous range, it may be a liquidity sweep.

On the other hand, when price breaks through a level with strong momentum, closes beyond it, and continues moving in the same direction, it may be a genuine breakout.

How to Trade Liquidity Sweeps
When price sweeps a swing high or swing low, don't rush into a trade immediately. Pay attention to how price behaves after the sweep.
If price takes out a swing low or high in a corrective manner and then moves away from it with strong displacement, you can drop to a lower timeframe and wait for a Market Structure Shift (MSS). Once the shift occurs, you can look for a potential entry using a Fair Value Gap.

Using a Point of Interest as Extra Confluence
Another way to trade liquidity sweeps is by combining them with a higher-timeframe Point of Interest (POI). This can help you identify areas where a liquidity sweep may provide a more meaningful trading opportunity.
For example, let's say price forms a swing low, and just below that low, there is a higher-timeframe bullish Point of Interest, such as a Fair Value Gap.

In this situation, you can anticipate that price may move lower, sweep the swing low, and tap into the higher-timeframe POI before making an aggressive move to the upside.

The advantage here is that you're not simply looking for price to sweep a random high or low. You're looking for the sweep to happen around an area that already has significance on the higher timeframe.
To trade this setup, you can look for a strong bullish candle formation around the POI on your chosen timeframe. Alternatively, you can drop to a lower timeframe and wait for a bullish Market Structure Shift, followed by a Fair Value Gap, to use as your entry model.
Remember, a higher-timeframe POI does not guarantee a reversal. Wait for price to reach the area and look for confirmation before considering a trade.
Conclusion
Liquidity is one of the basic concepts you need to understand when learning ICT. It helps you identify where orders may be resting, where price could be heading, and where potential trading opportunities may develop.
But don't just mark every high and low on your chart and assume price must take them out.
Instead, pay attention to the levels that matter, and observe how the market reacts when those levels are reached.
The goal is not just to identify liquidity. It's to understand how price behaves around it and use that information alongside your bias, market structure, and entry model.
Watch Youtube Video
What Is Liquidity?
Liquidity refers to the availability of orders in the market. Every buyer needs a seller, and every seller needs a buyer for a transaction to take place.
As traders place their orders, liquidity builds up around certain areas of the chart. These areas become important because many traders tend to place their entry orders and stop losses around the same price levels.
One of the easiest ways to identify these areas is by looking at swing highs and swing lows.
Buy-Side Liquidity (BSL)
Buy-side liquidity is the liquidity that forms above swing highs.
Why does it form there? Because different traders place their orders around these levels.
For example, breakout traders may place buy-stop orders above a swing high because they want to buy when price breaks above it. Traders who are already in sell positions may also place their stop losses at the same high.
When these orders gather around a similar area, it creates a pool of buy-side liquidity.
Sell-Side Liquidity (SSL)
Sell-side liquidity is the opposite. It forms below swing lows.
Breakout traders may place sell-stop orders below a swing low because they want to sell if price breaks below it. At the same time, traders who are already in buy positions may place their stop losses below that low.
These orders can gather around the same area, creating a pool of sell-side liquidity.
The easiest way to remember the difference is:
Buy-side liquidity: Above the highs.
Sell-side liquidity: Below the lows.
These are important areas to watch because price can move toward them to trigger the orders resting around those levels.
What Is a Liquidity Sweep?
Now that you understand where liquidity forms, let's talk about the liquidity sweep.
A liquidity sweep happens when price moves beyond a swing high or swing low, takes out the liquidity around that level, and then reverses back across it.
For example, price may move above a swing high, trigger the buy-side liquidity resting above it, and then reverse aggressively to the downside.
This can trap traders who bought the breakout, while also triggering the stop losses of traders who were already selling.
The same thing can happen below a swing low. Price moves below the low, takes out the sell-side liquidity, and then reverses higher.
This is why liquidity sweeps are important in ICT. They help you identify situations where price takes liquidity on one side of the market before potentially moving in the opposite direction.
However, the sweep itself is not an entry signal. After a sweep, you still want to see how price reacts. An impulsive move away from the level and a market structure shift can provide additional confirmation before looking for an entry.
Liquidity Sweep vs Breakout: How Do You Tell the Difference?
One important thing to understand is that not every move above a swing high or below a swing low is a liquidity sweep. Sometimes price is simply breaking out and continuing in the same direction.
So, how do you tell the difference?
The first thing to look at is how price approaches the level and what happens after it breaks through.
When price approaches a level and then briefly moves beyond it before quickly reversing back inside the previous range, it may be a liquidity sweep.
On the other hand, when price breaks through a level with strong momentum, closes beyond it, and continues moving in the same direction, it may be a genuine breakout.
How to Trade Liquidity Sweeps
When price sweeps a swing high or swing low, don't rush into a trade immediately. Pay attention to how price behaves after the sweep.
If price takes out a swing low or high in a corrective manner and then moves away from it with strong displacement, you can drop to a lower timeframe and wait for a Market Structure Shift (MSS). Once the shift occurs, you can look for a potential entry using a Fair Value Gap.
Using a Point of Interest as Extra Confluence
Another way to trade liquidity sweeps is by combining them with a higher-timeframe Point of Interest (POI). This can help you identify areas where a liquidity sweep may provide a more meaningful trading opportunity.
For example, let's say price forms a swing low, and just below that low, there is a higher-timeframe bullish Point of Interest, such as a Fair Value Gap.
In this situation, you can anticipate that price may move lower, sweep the swing low, and tap into the higher-timeframe POI before making an aggressive move to the upside.
The advantage here is that you're not simply looking for price to sweep a random high or low. You're looking for the sweep to happen around an area that already has significance on the higher timeframe.
To trade this setup, you can look for a strong bullish candle formation around the POI on your chosen timeframe. Alternatively, you can drop to a lower timeframe and wait for a bullish Market Structure Shift, followed by a Fair Value Gap, to use as your entry model.
Remember, a higher-timeframe POI does not guarantee a reversal. Wait for price to reach the area and look for confirmation before considering a trade.
Conclusion
Liquidity is one of the basic concepts you need to understand when learning ICT. It helps you identify where orders may be resting, where price could be heading, and where potential trading opportunities may develop.
But don't just mark every high and low on your chart and assume price must take them out.
Instead, pay attention to the levels that matter, and observe how the market reacts when those levels are reached.
The goal is not just to identify liquidity. It's to understand how price behaves around it and use that information alongside your bias, market structure, and entry model.
Watch Youtube Video


Read all

Free market insights and exclusive updates, straight to your inbox.
No spam. We hate it as much as you do.
Copyright © 2025 ChartTactix. All rights reserved.
Free market insights and exclusive updates, straight to your inbox.
No spam. We hate it as much as you do.
Copyright © 2025 ChartTactix. All rights reserved.
Copyright © 2025 ChartTactix. All rights reserved.
Market insights and exclusive updates.
No spam. We hate it as much as you do.
Copyright © 2025 ChartTactix. All rights reserved.
Market insights and exclusive updates.
No spam. We hate it as much as you do.